Ever since I was able to share the Internet connection among the several computers we had at home 30+ years ago, I’ve always found it interesting the many ways computers can connect. First I learned about IPv4, then VPNs such as OpenVPN and Wireguard, and now IPv6.
Fast forward several years, and after running a IPv6-in-IPv4 tunnel thanks to Hurricane Electric, my ISP provided a delegation of IPv6 addresses which I could share among my machines. Several more years later, I wondered, how much IPv6 was I using instead of IPv4 now that all my internal machines had IPv6 addresses? I knew about ntop and how it provides visualiations for traffic analysis. Figuring out how to wire it up to my network, and explaining it, is the point of this post.
OpenBSD is the central router/fw on my network, so I knew it would have a view of all the traffic.
OpenBSD provides pflow(4) psuedo-devices to export the pflow accounting data.
Simple enough:
/etc/pf.conf:
set state-defaults pflow
Now any connection states created have their metadata exported on the pflow interface.
Now to configure where to send the pflow data.
/etc/hostname.pflow0:
flowsrc 10.10.2.1 flowdst 10.10.2.213:2055 pflowproto 10
This says: Send pflow data using IPFIX (pflowproto 10) as the netflow version, with a source address of 10.10.2.1 over UDP to 10.10.2.213 on port 2055.
On the other end of this needs to be a pflow collector.
ntop offers one called nprobe. The problem with this is, several releases (years?) ago, it went to a paid-only model. Given I’m merely setting this up out of curiosity for my home network, I’m not ready to put down money. It’s 299.95 Euro for a permanent license. A little rich for my home hobbyist blood.
Casting about around Github I found netflow2ng, a golang-based NetFlow collector for ntopng. It claims to only support v9, but after reading several issues in the repository and doing my own local testing, IPFIX worked just fine.
I now had all the pieces figured out. Now to to connect it all:
graph TB;
A[OpenBSD]-->B[netflow2ng]-->C[ntopng]
But what’s the easiest (laziest) way to run this all? Containers with docker compose!
tl;dr: It turned out to be pretty easy once I figured out that having Redis configured correctly is important to having the configuration saved between restarts. I couldn’t quite get the in-built Redis to work with the ntopng container, so I ran another instance I could more specifically configure.
My docker-compose.yml:
services:
  ntop:
    image: ntop/ntopng:stable
    container_name: ntop
    ports:
      - 3080:3080
      - 3443:3443
    command:
      - "--community"
      - "--data-dir=/rundir/data"
      - "--http-port=3080"
      - "--https-port=3443"
      - "--instance-name=ntop1"
      - "--interface=zmq://netflow2ng:5556"
      - "--local-networks=10.10.0.0/16,2600:xxxx:yyyy:zzzz::/56"
      - "--no-promisc"
      - "--pcap-dir=/rundir/pcap"
      - "--redis=redis:7777"
    volumes:
      - type: bind
        # Path on actual host
        source: /opt/ntopng
        target: /rundir
    restart: unless-stopped
  redis:
    image: redis:latest
    container_name: redis
    ports:
      - 7777:7777
    command:
      - "--save 600 1"
      - "--port 7777"
    volumes:
      - type: bind
        source: /home/ntop/redis
        target: /data
    restart: unless-stopped
  netflow2ng:
    container_name: netflow2ng
    image: synfinatic/netflow2ng:latest
    command:
      - "--log-level=info"
    restart: unless-stopped
    ports:
      - 5566:5556/tcp
      - 8080:8080/tcp
      - 2055:2055/udp
pflow traffic flow layout:
graph LR
openbsd[OpenBSD]-- "udp/2055" -->netflow2ng["netflow2ng"]
ntopng-- "tcp/7777" -->redis["redis"]
user[user]-- "tcp/3080, tcp/3443" -->ntopng
ntopng-- "tcp/5556" -->netflow2ng
subgraph Container
netflow2ng
ntopng
redis
end
OpenBSD sends netflow data to port udp/2055 of the host, I can access ntop over port 3080 http or 3443 on https to view traffic analysis.
Finding the answer to my original question required more Googling. I’m still curious why getting charts of IPv4 versus IPv6 traffic are buried in the UI:
ntopng -> Interface -> Details -> Packets:
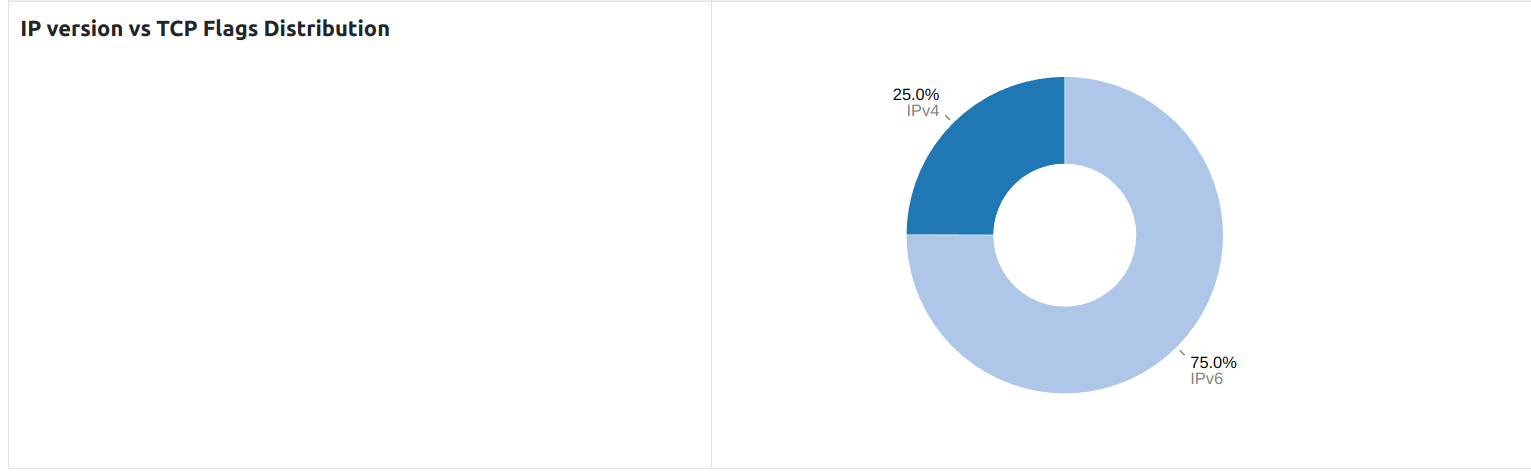
I almost couldn’t believe the image. 75% IPv6, really?
I found a chart to show me per-protocol traffic over the past week:
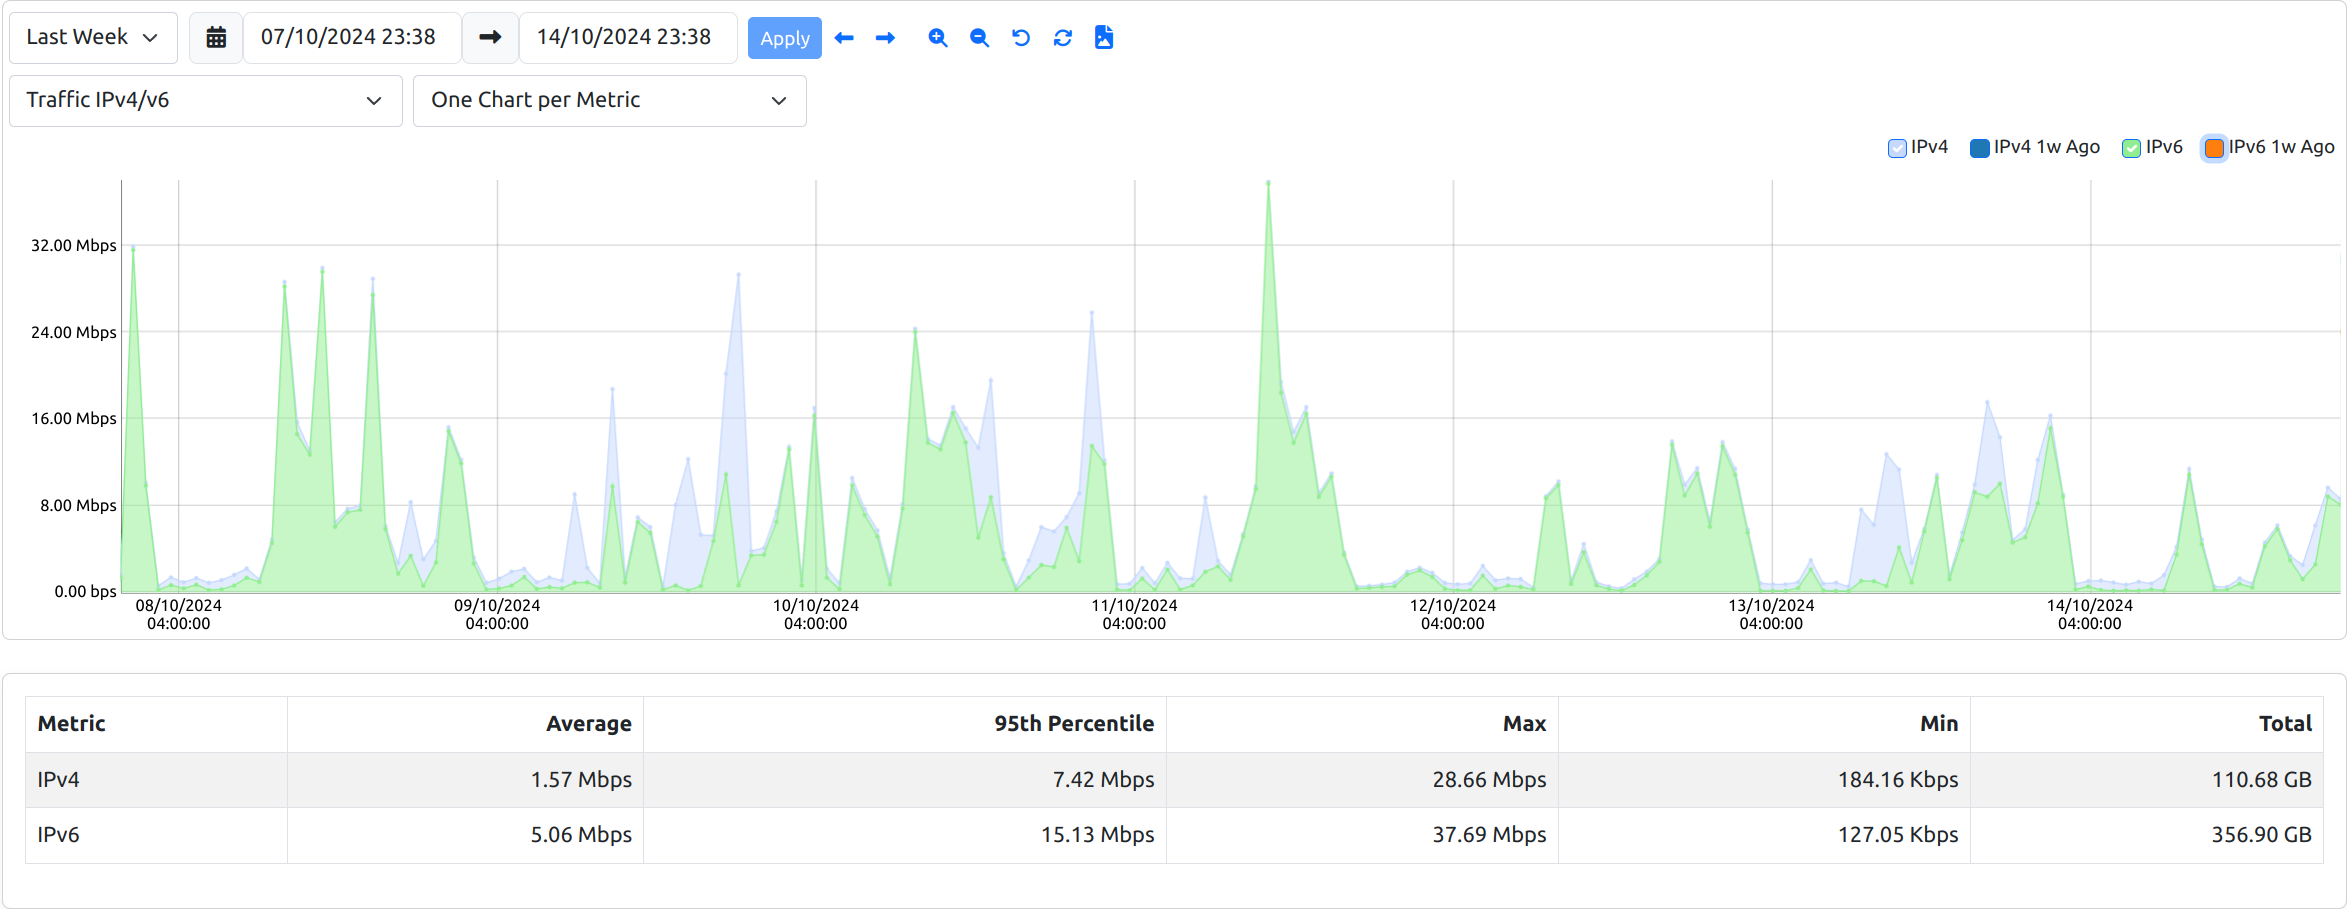
Sure enough, roughly 75%. Most of the traffic is local->remote, as I am still solidifying my internal IPv6 plan.
I am pretty impressed to say the least. Victory.